Detailed Guide: How To Use The Traffic Analyzer?

Scalenut’s Traffic Analyzer is built to power the next generation of content strategies.
As part of Scalenut’s shift from traditional SEO to a GEO platform, this tool goes beyond surface-level metrics to help you understand how your content performs across search engines. It unpacks the complex web of site interactions and delivers meaningful insights into user behavior, traffic shifts, and content engagement.
Let’s begin.
Note: To use the Traffic Analyzer, you’ll need to connect your Google Search Console to your Scalenut account.
For a step-by-step setup, refer to our integration guide to get started seamlessly.
How to use the Traffic Analyzer?
STEP 1
Log in to your Scalenut account and find the ‘Traffic Analyzer’ feature on the left navigation panel under Apps section of Scalenut Dashboard.

STEP 2
The data available on your Traffic Analyzer Dashboard are as follows -
Domain name
Country - You can filter and view data for the country as per your preference. Max 5 countries can be tracked
Last Data refresh time and next refresh time.
Traffic refers to the number of clicks received from Google Search engine.
Impressions refer to the number of times a web page is displayed to users.
Average Position is a website's weighted average ranking in search engine results pages (SERPs) for all pages and queries.
CTR measures the number of clicks received in comparison to the number of people who viewed it.
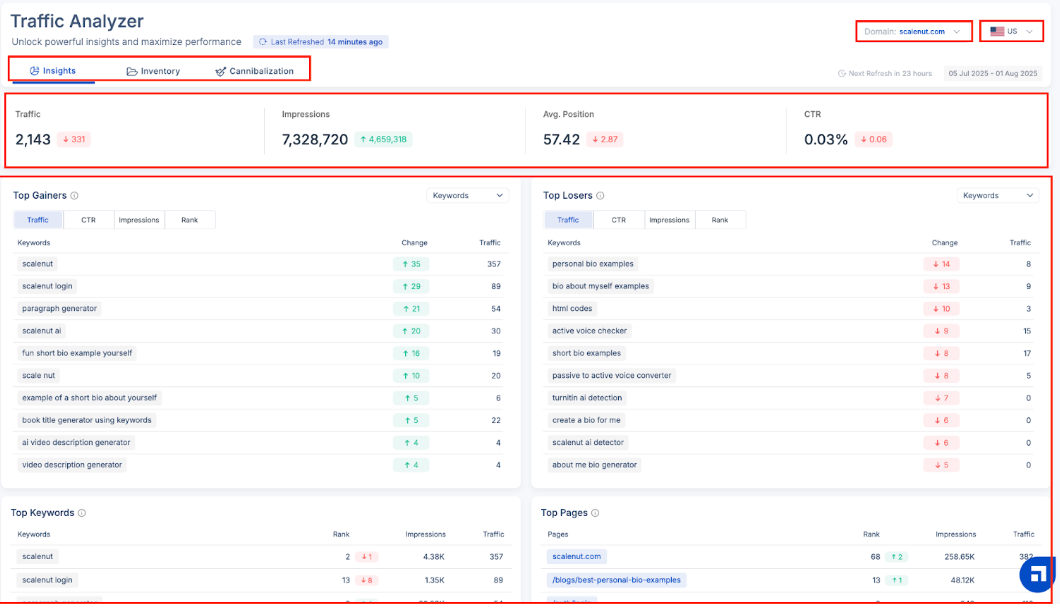
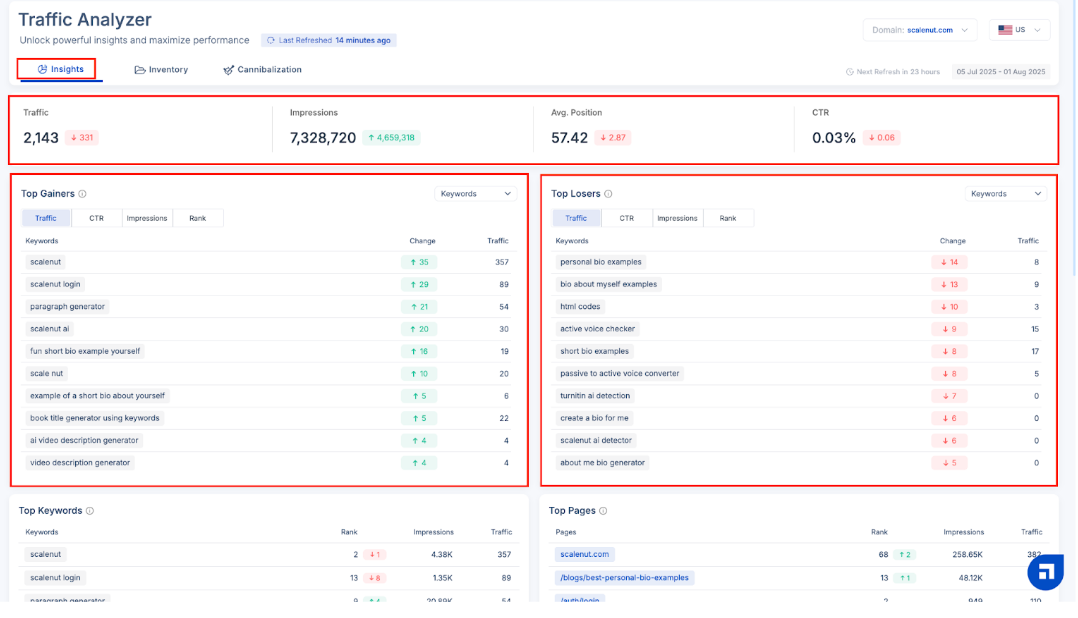
STEP 3
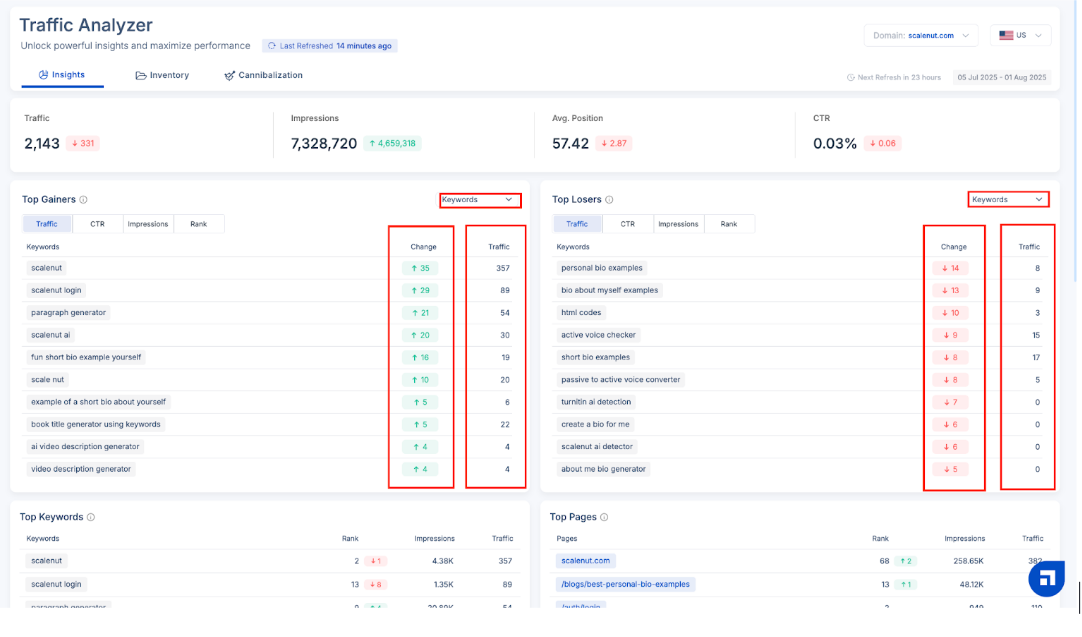
The default screen is the ‘Insights’ screen. Right below the overview, you’ll find the Top Gainers and the Top Losers data.
Top Gainers - Pages that made the biggest leaps last month.
Top Losers - Top underperforming pages month-to-month.
STEP 4
You'll find ‘Keywords' beside 'Top Gainers' and 'Top Losers.' Click on the downward arrow to filter it as 'Pages' instead of 'Keywords. Then, select your preference.
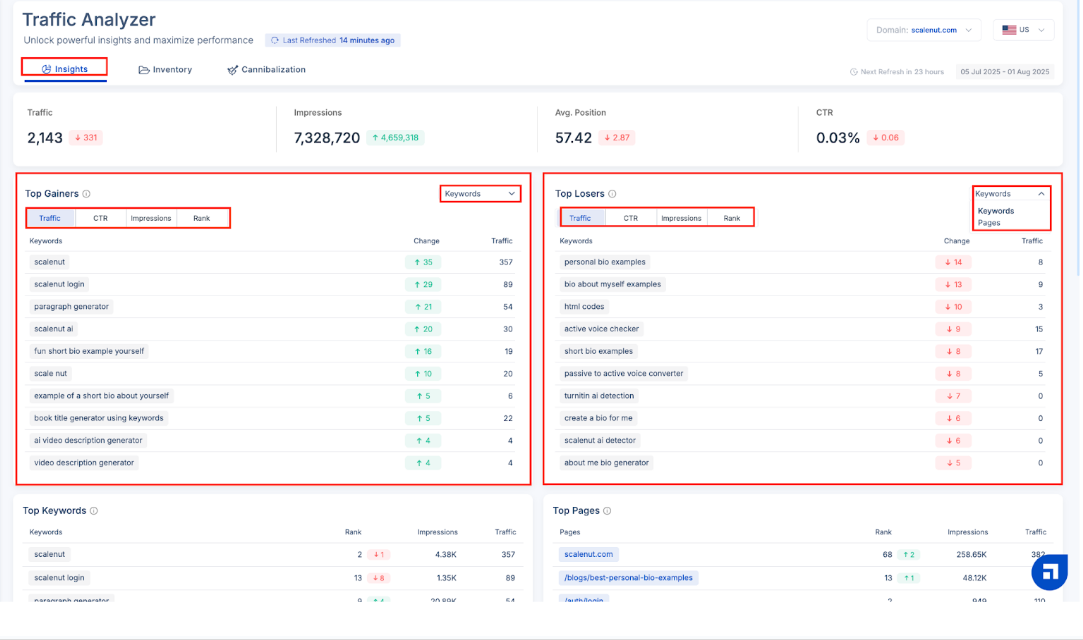
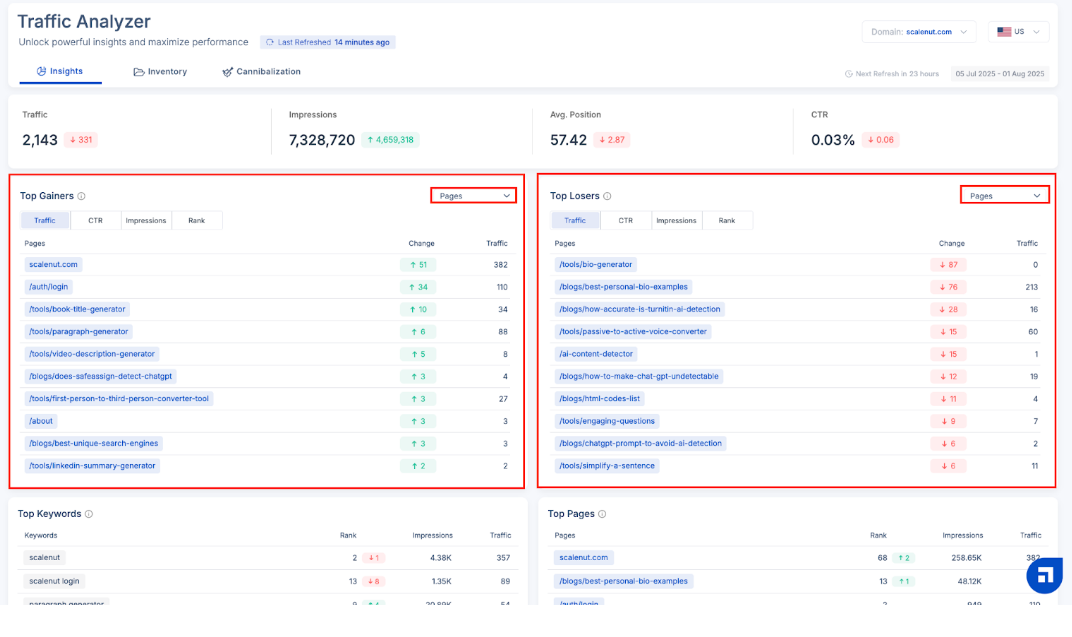
STEP 5
If you wish to stick to ‘Keywords’, do not alter this filter. If not, change it to ‘Pages’ by clicking on the downward arrow and selecting your preference.
STEP 6
Now, let’s consider the data as per ‘Keywords.’ You’ll find the Change and the Traffic data beside each keyword.
Please note: For Top Gainers, change will indicate the positive movement, whereas, for the Top Losers, it’ll be the negative movement.
STEP 7
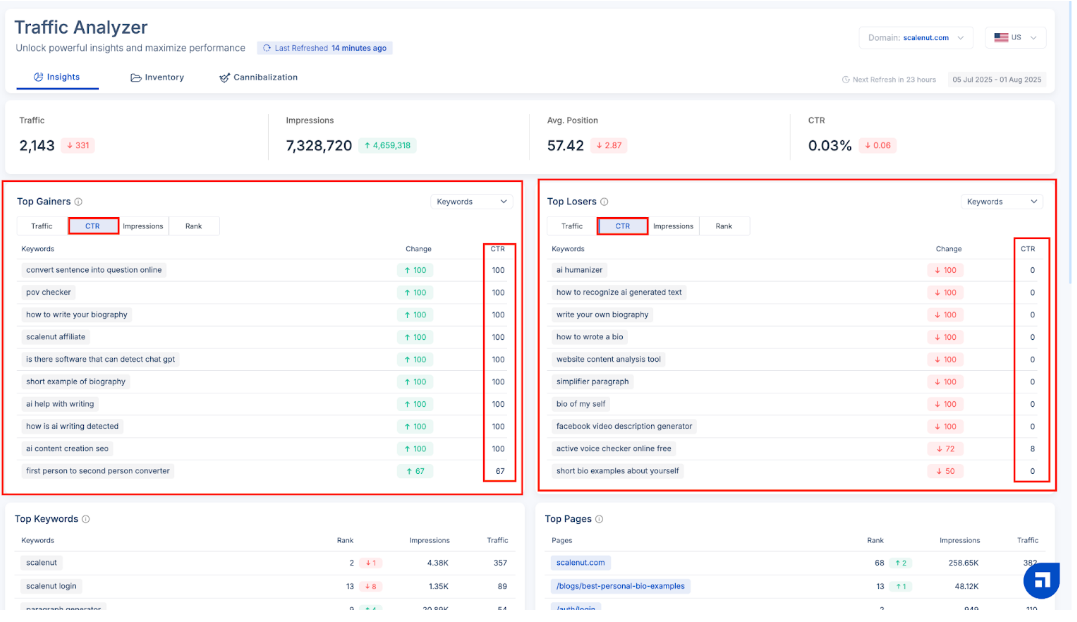
Next, switch to ‘CTR.’ Here, you can track the keywords, change in movement, and the CTR (the number of clicks received compared to the number of people who viewed it).
STEP 8
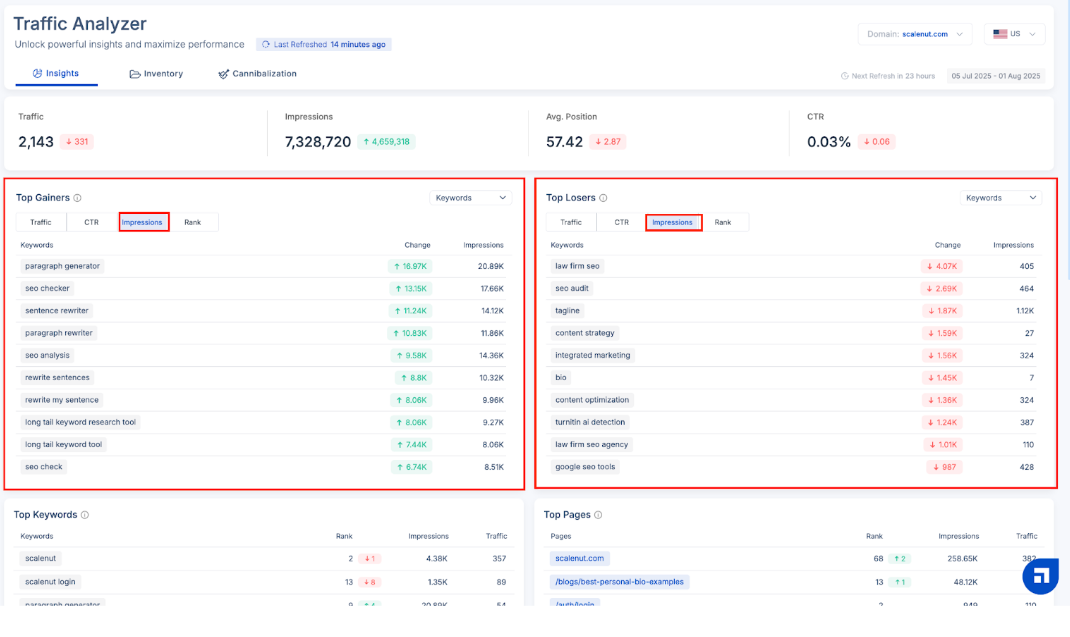
Then, switch to the ‘Impressions’ tab. Impressions refer to the number of times a web page is displayed to users. Here, you can track the keywords, changes in movement, and impressions. You can tally it for both Top Gainers and Top Losers side by side.
STEP 9
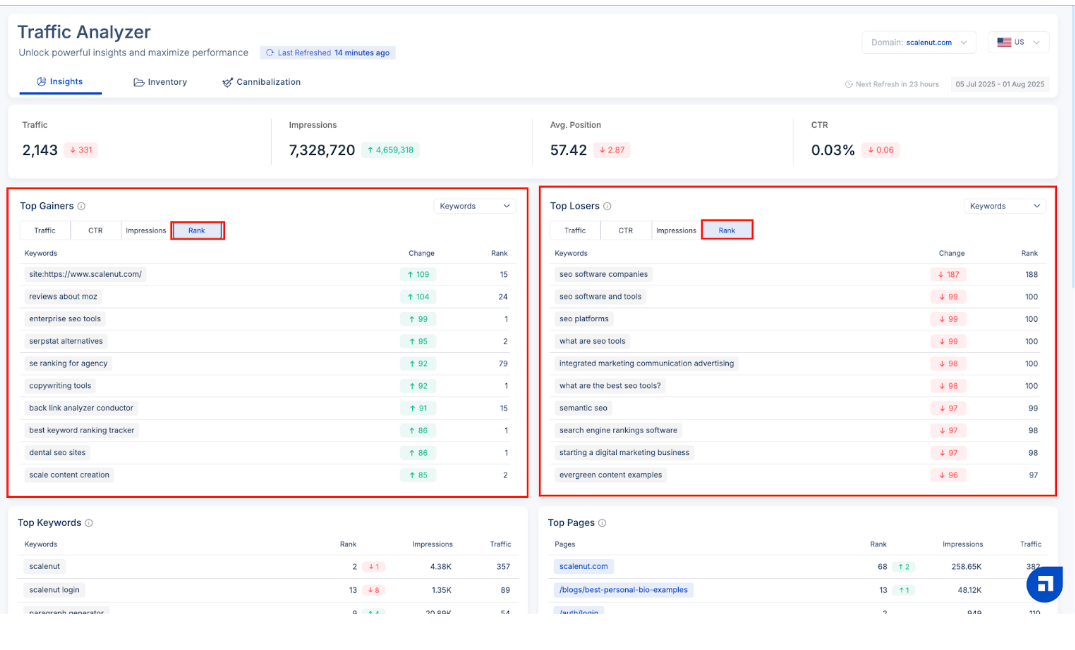
Finally, switch to the ‘Rank’ tab. Here, you can track the keywords, changes in movement, and the rank for them.
STEP 10
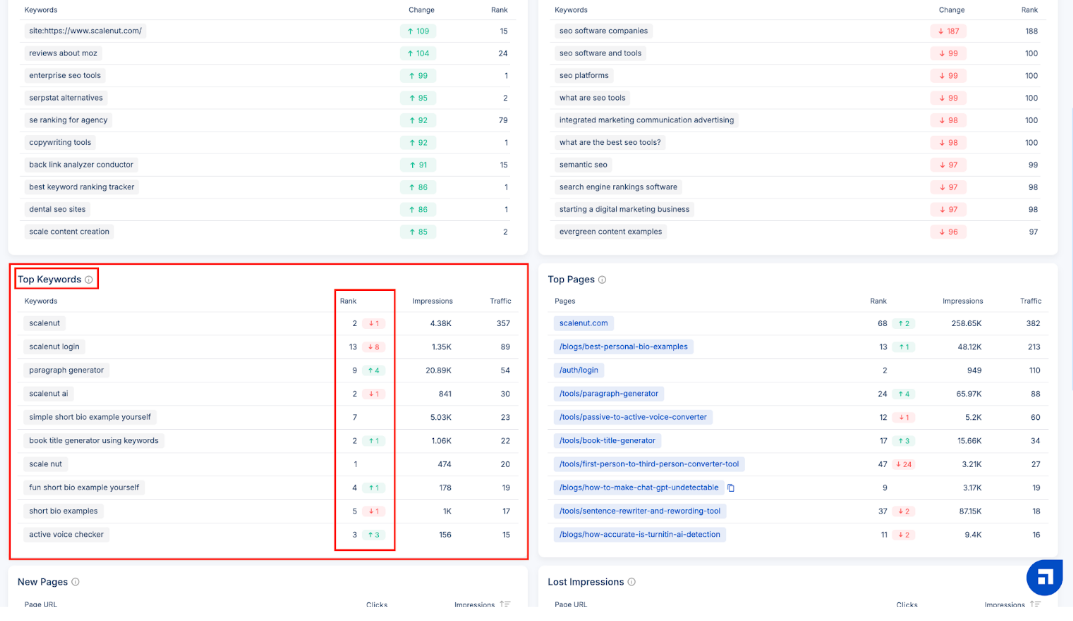
Scroll down, and you’ll find the ‘Top Keywords’ . If you see data in red beside the current rank of the keyword, it shows a drop in its rank. Similarly, a shift marked in green indicates a positive movement in the rank of the particular keyword. The impressions and traffic of the keyword are also available here.
STEP 11
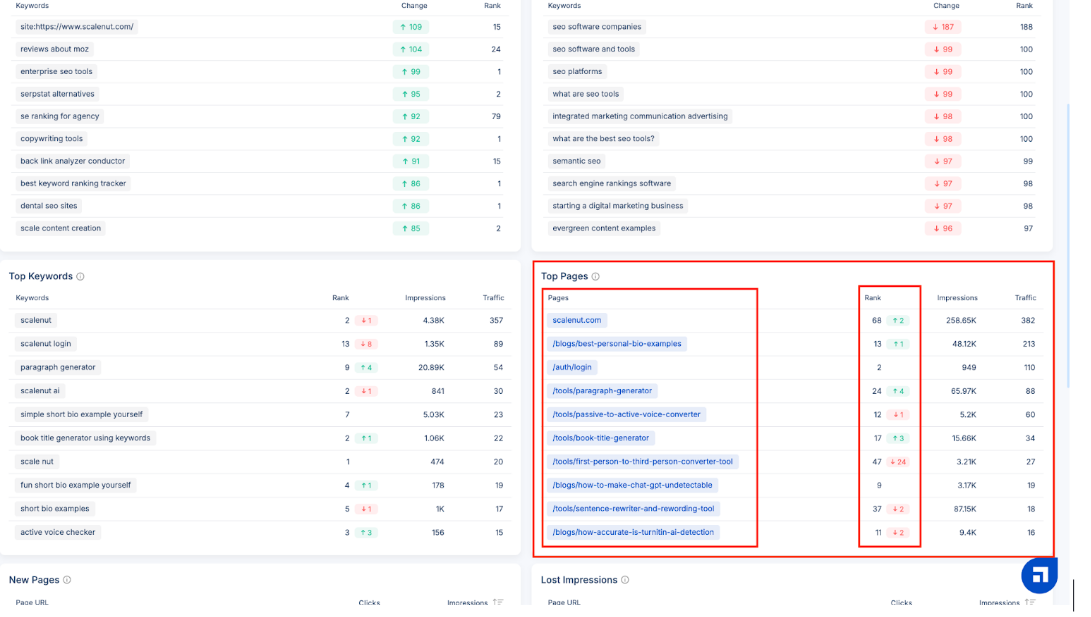
Next, you’ll find the ‘Top Pages’ - pages that drive the highest traffic to the website. If you see data in red beside the current rank of the page, it shows a drop in its rank. Similarly, a shift marked in green indicates a positive movement in the rank of the particular page. The impressions and traffic of the page are also available here.
STEP 12
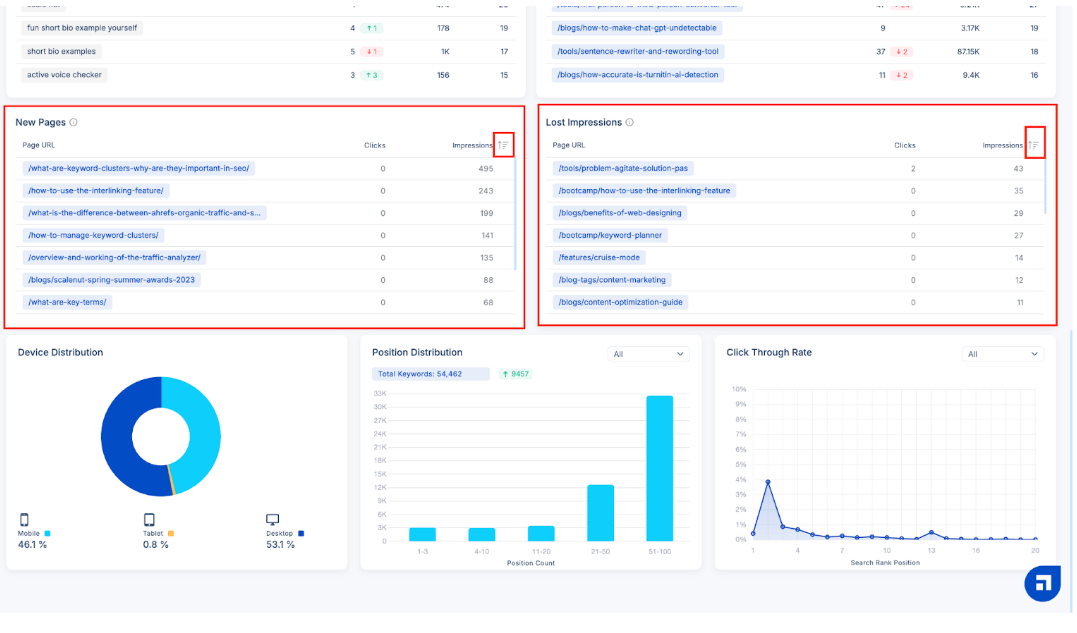
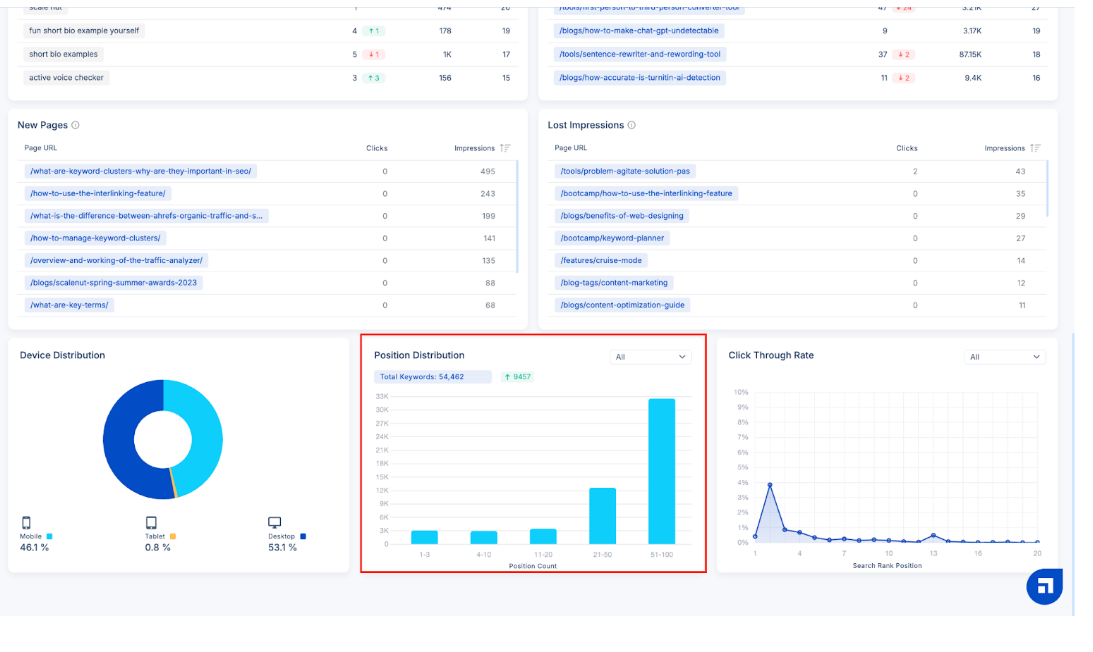
Scroll further down the page to find the data for ‘New Pages’ and ‘Lost Pages.’
New Pages are web pages previously absent from search engine rankings but have now gained visibility. In contrast, Lost Impressions are web pages that received impressions in the last to last month but have had no engagement within the past month.
You can also view them in ascending or descending order of impressions by clicking the filter.
STEP 13
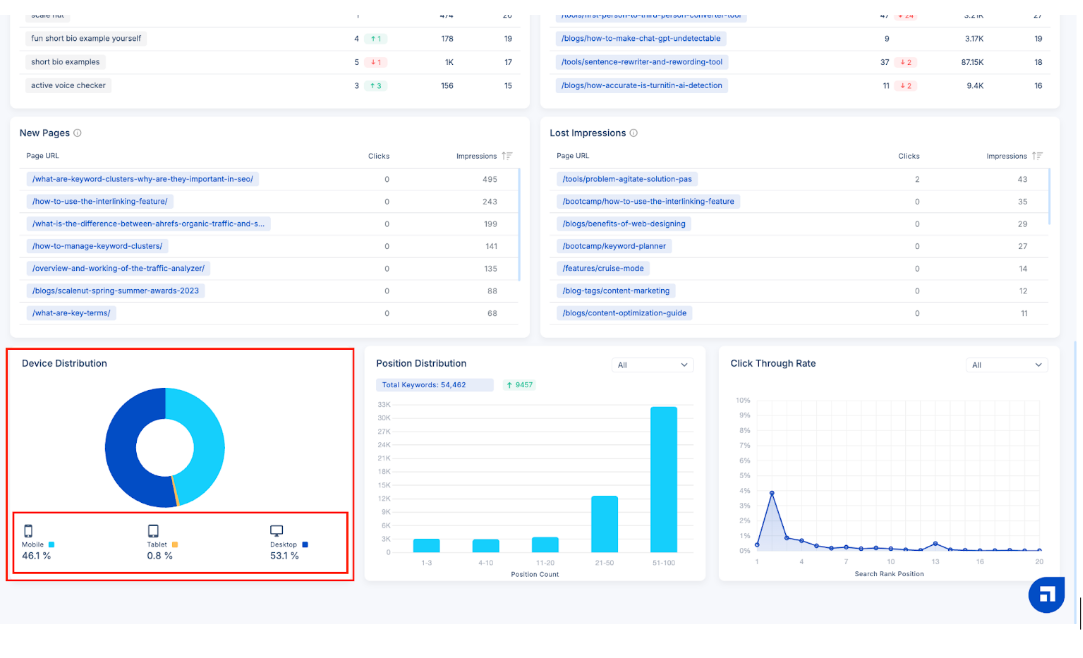
Next, you'll be able to monitor the ‘Device Distribution’. It shows the visual representation of the source distribution from different devices, like desktops, tablets, and smartphones.
STEP 14
Next, comes the Position Distribution. It shows when a keyword appears in different search engine result pages, such as top 3, 4-10, and beyond. You can also view the change in movement of the keywords and the total keyword number.

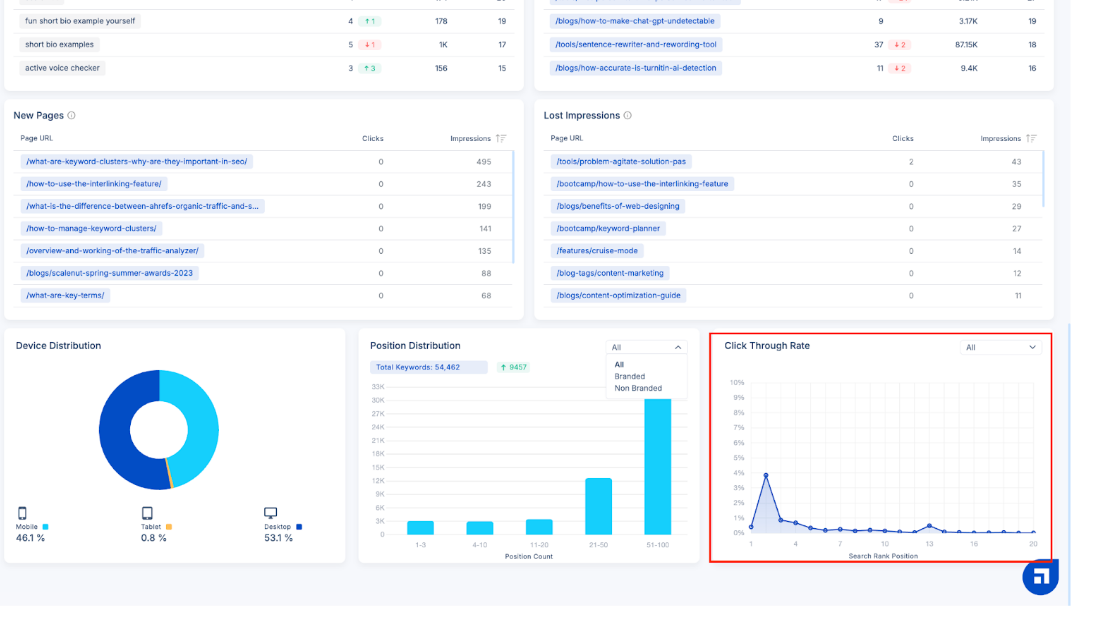
STEP 15
You can further sort the position distribution of these keywords by clicking on the downward arrow. The default view considers all keywords, but you can filter them as branded and non-branded.
STEP 16
CTR measures the number of clicks received in comparison to the number of people who viewed it.

STEP 17
You can further sort the CTR of these keywords by clicking on the downward arrow. The default view considers all, but you can filter them as branded and non-branded.
STEP 18
Next, switch to the ‘Inventory’ Tab.
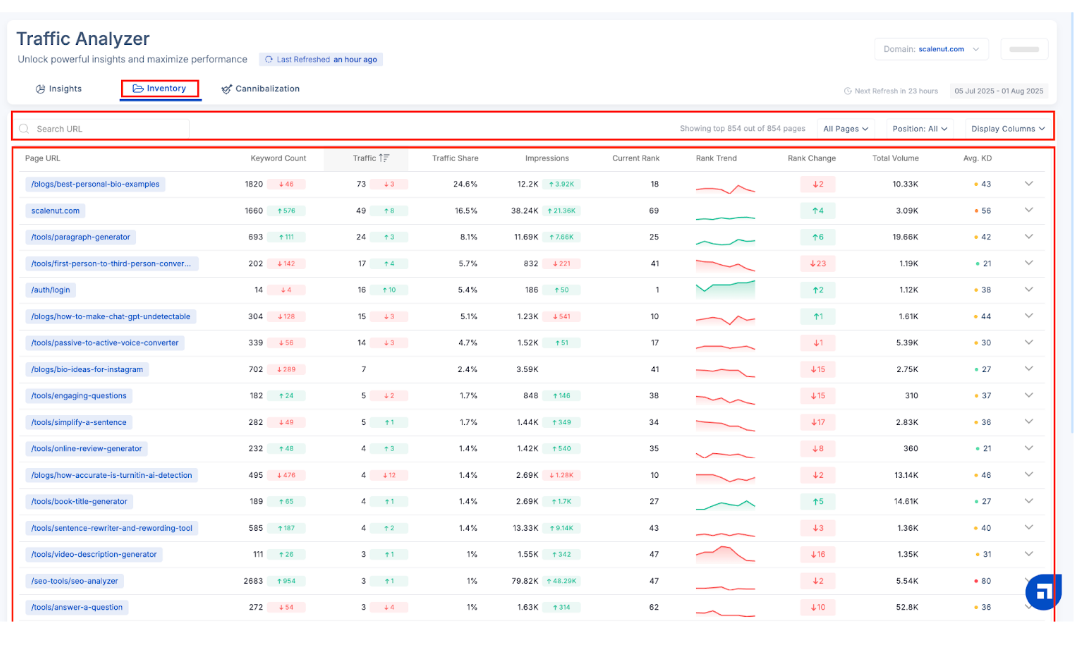
In this section, you’ll come across the following data -.
Keyword Count: Total number of keywords in past 28 days V/S change in total number of keywords in previous 28 days.
Traffic: Compare the website impressions in the last 28 days to the traffic change from the previous month.
Traffic Share: The measure of a page's traffic percentage within overall website visits.
Impressions refer to the number of times a web page is displayed to users.
Current Rank:The present rank of the page.
Rank Change - Shows how your page’s rankings have moved up or down over time, offering context into whether your content is improving or losing ground in search visibility.
Rank Trend:The page’s overall ranking movement over 8 weeks.
Total Volume:Total search volumes for the top 10 keywords.
Average KD: Indicates a keyword's weighted average keyword difficulty in ranking well in search engine results.
STEP 19
You can view the data for All Pages (default view) or choose among Top Gainers, Losers, and New Pages. All you need to do is click the down arrow and choose your preference.
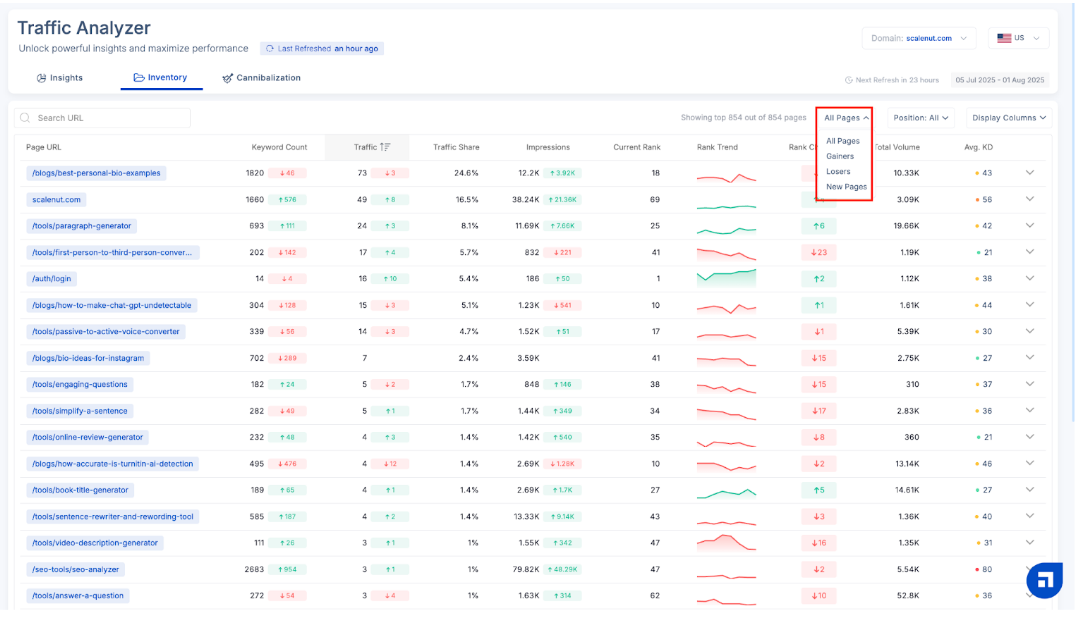
STEP 20
Similarly, you can do the same with the ‘Display Columns.’ Click the down arrow, select the data you want to see, and customize your experience. You cannot deselect the Page URL; the rest is at your convenience.
Note: Deselecting removes the data for that from your screen.

STEP 21
To expand the data for each page URL, click the down arrow.

STEP 22
It’ll show you the top 10 ranking keywords for that page and Avg. Rank, Rank Trend, Rank Change, Traffic, Impressions, CTR, Volume and KD for the specific ranking keyword.

STEP 23
You can further sort each of the data for the top 10 ranking keywords such as their Avg Rank, Rank Trend, Rank Change, Traffic, Impressions, CTR, Volume and KD by clicking on the filter arrow beside them.

STEP 24
Close the expanded view to go to the main Inventory screen. Then, switch between Traffic, Traffic Share, Impressions, Current Rank, Rank Trend, Rank Change Total Volume, and average KD to view their respective data. In this case, we are looking at the ‘Traffic’ data. Click on your desired term to view results for it. You can also expand, like in the case of the Keyword Count.

STEP 25
Scroll down to the bottom of the page to find the number of pages shown. The default is 25; however, it is customizable as per choice. Just click the down arrow and select your desired number of rows. You can choose from as low as 10 rows to as high as 100 rows to track your website's performance.

STEP 26
Cannibalization happens when multiple pages from your website compete for the same keyword. Instead of reinforcing authority, it sends mixed signals to search engines and generative engines—leading to lower rankings, reduced visibility, and fragmented traffic.
Scalenut’s Traffic Analyzer helps you detect and fix these overlaps—so your content stands out with precision and purpose.

What You’ll Find in the Cannibalization Report?
This section gives you a clear, data-backed view of how overlapping content may be impacting your site’s performance:
Keyword - The term that’s triggering multiple pages from your site in search results—creating confusion for both algorithms and users.
Cannibalization Index - A score that reflects the degree of overlap. The higher the index (closer to 1), the more severe the internal competition.
Total Impressions - The number of times the cannibalized keyword appeared in search results across all affected pages in the last 28 days. This reflects visibility, but not necessarily efficiency.
Total Traffic - The actual clicks these impressions generated. If traffic is low despite high impressions, cannibalization could be holding you back.
Traffic Share - The percentage of your overall site traffic that this keyword drives. Lower share may indicate that multiple pages are diluting potential impact.
CTR (Click-Through Rate) - Measures how many users clicked after seeing the keyword. Fragmented content typically leads to lower CTR due to less relevant or weaker ranking pages.
Affected Pages - The number of pages competing for the same keyword. Ideally, a high-intent keyword should be clearly owned by one optimized, authoritative page.
STEP 27
The values are between 0-1. 1 means absolute cannibalization. You need to look at them. 0 means you can neglect them. You can further expand the data by clicking on the ‘drop-down arrow’.
The extended view shows a graph. It is a representation of different URLs and rank with respect to date. This view also has the number of Affected Pages for the keyword, along with the Page URL, Rank, Impressions, Impressions Share, Traffic, Traffic Share and CTR.

To exit the extended view, simply click on the same arrow.
Quick Tip: You can also filter the Rank.
To know about the Cannibalization feature in detail, you can also refer here.
And Voila! We have covered all the functionalities of the Traffic Analyzer.